Compare with 1 courses

Project 13 - Setting Up a Monitoring Stack Using Grafana, Prometheus, and Node Exporter on Ubuntu
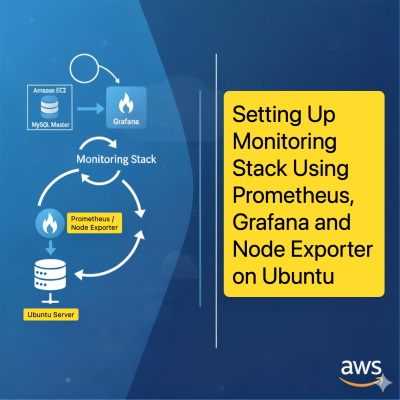
Project 13 - Setting Up a Monitoring Stack Using Grafana, Prometheus, and Node Exporter on Ubuntu

$10

Learn how to build a complete monitoring stack on Ubuntu using Grafana, Prometheus, and Node Exporter. Deploy a multi-server monitoring system, visualize real-time metrics, and gain hands-on experience with industry-standard observability tools.

Learn more
Has discount
Expiry period 1 Months
Made in English
Last updated at Tue Dec 2025
Level
Intermediate
Total lectures 1
Total quizzes 0
Total duration Hours
Total enrolment 0
Number of reviews 0
Avg rating
Short description Learn how to build a complete monitoring stack on Ubuntu using Grafana, Prometheus, and Node Exporter. Deploy a multi-server monitoring system, visualize real-time metrics, and gain hands-on experience with industry-standard observability tools.
Outcomes
  • Deploy and configure Grafana, Prometheus, and Node Exporter on Ubuntu servers
  • Set up a multi-server monitoring architecture using AWS EC2
  • Integrate Prometheus as a data source in Grafana
  • Import and customize pre-built dashboards for system monitoring
  • Monitor real-time server metrics and visualize them in Grafana
Requirements
  • An AWS account (free tier eligible)
  • Basic knowledge of SSH and Linux terminal commands
  • Ubuntu 22.04 LTS on all servers (or compatible)
  • Internet access to download binaries and packages
  • A modern web browser for accessing Grafana and Prometheus UI's